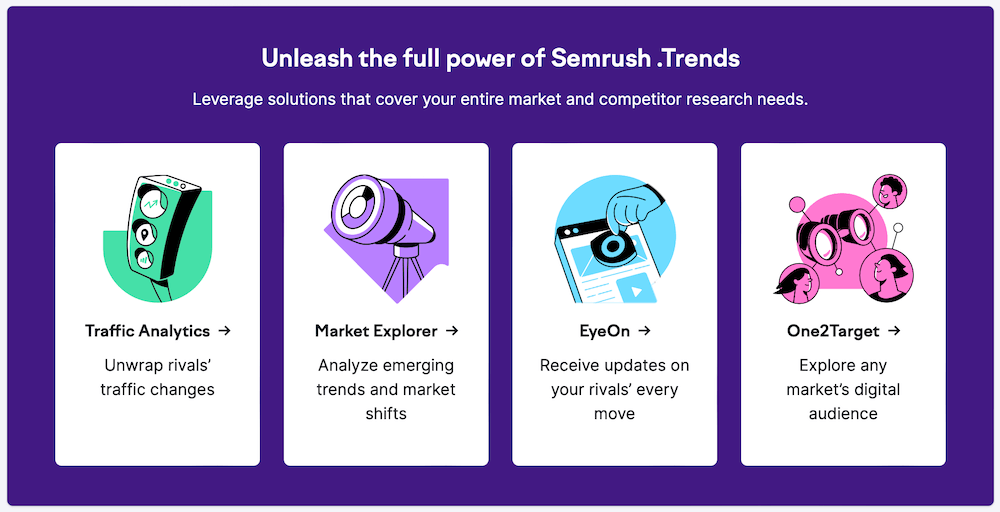
Semrush .Trends is a competitive intelligence tool that is available as an add-on with any paid
.Trends comprises of the following solutions:
- Traffic Analytics – provides a detailed overview of any company's online performance.
- Market Explorer – enables deep insights of competitors in your niche or industry.
- EyeOn – automatically monitors your competitors' activities, including new content and promotional changes.
- One2Target – offers unique insights into audience characteristics, including demographics, socioeconomics, behavior, and audience overlap.
With these four powerful tools in your marketing arsenal, you can get an in-depth overview of your market and uncover deep competitor insights to identify potential areas for growth and gain a strategic advantage in the market.
In this post, we'll reveal 7 actionable tips to use
Important Note: To dive into these actionable tips, you'll need an up-and-running
Get a 2-week free trial to Semrush .Trends + Semrush Pro, gaining access to all .Trends tools and 45+ Semrush features.
Table of Contents
- Semrush .Trends Pricing
- 7 Ways to Use Semrush .Trends for Competitor Analysis
- 1. Analyze Your Market or Niche (with Market Explorer)
- 2. Gather Detailed Traffic Insights for Competing Websites (with Traffic Analytics)
- 3. Benchmark Your Website Against Competitors (with Traffic Analytics)
- 4. Analyze Your Competitors' Top Pages (with Traffic Analytics)
- 5. Examine Your Competitors' Top Subdomains and Subfolders (with Traffic Analytics)
- 6. Automate Competitor Tracking (with EyeOn)
- 7. Research Your Audience (with One2Target)
- Final Thoughts
Semrush .Trends Pricing
Before we dive into the nitty-gritty of using
If you're an existing
If you don't have an active
- Semrush Pro – $329.95/month
- Semrush Guru – $449.95/month
- Semrush Business – $699.95/month
Get a 2-week free trial to Semrush .Trends + Semrush Pro, gaining access to all .Trends tools and 45+ Semrush features.
7 Ways to Use Semrush .Trends for Competitor Analysis
1. Analyze Your Market or Niche (with Market Explorer)
If you're using the tools in .Trends for the first time, the best place to start with would be the Market Explorer tool. With this tool, you can analyze any market or niche and get a complete breakdown of the market dynamics and the audience you'd like to target.
Furthermore, Market Explorer can also be used to benchmark your competitors and get a thorough understanding of the market and competitive landscape.
To get started, you need to decide how you'd like to define your market.
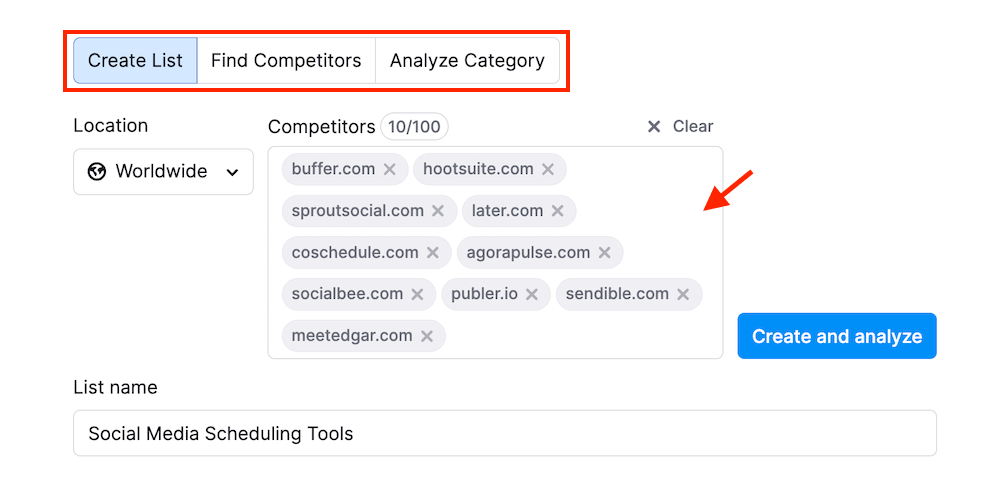
Market Explorer provides 3 options:
- Create List – This option is useful if you already have a fair idea about the competitive landscape or if you want to research a specific niche within a broader market.
- Find Competitors – If you aren't familiar with the competitive landscape, this is the option to select as it will select your closest competitors based on your search presence.
- Analyze Category – Select this option if you want a broad picture of the entire market.
Let's pick the "Create List" option for this particular example to examine the "social media scheduling tools" market based on top social media scheduling tools like Buffer, Hootsuite, SproutSocial, etc.
Side note: If you have trouble finding competitors in your niche, you can use the autosuggest option that the tool offers.
When you access the Market Overview report, the first thing you'll see is the Market Summary widget. It offers a set of metrics for a quick assessment of your market. The information presented here is to provide a broad market view, including its size, value, and competition levels.
Pay special attention to the market size graph, market consolidation (low or high consolidation), and market traffic.
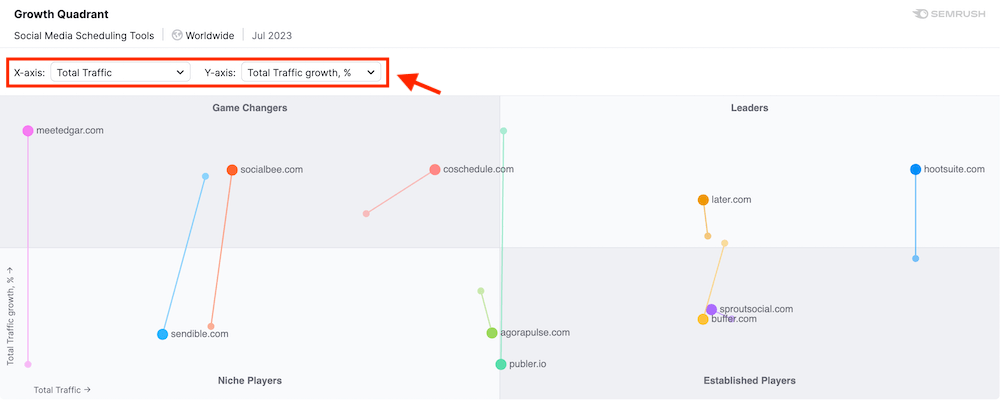
Next, you'll find the Growth Quadrant matrix, which paints a visual representation of the overall competitive landscape within your market, showing where each of your competitors stand over a given period.
The domains are divided into 4 quadrants:
- Niche Players
- Game Changers
- Leaders
- Established Players
In essence, this matrix is like your secret decoder to understanding who's doing what and where they fit into the competitive landscape.
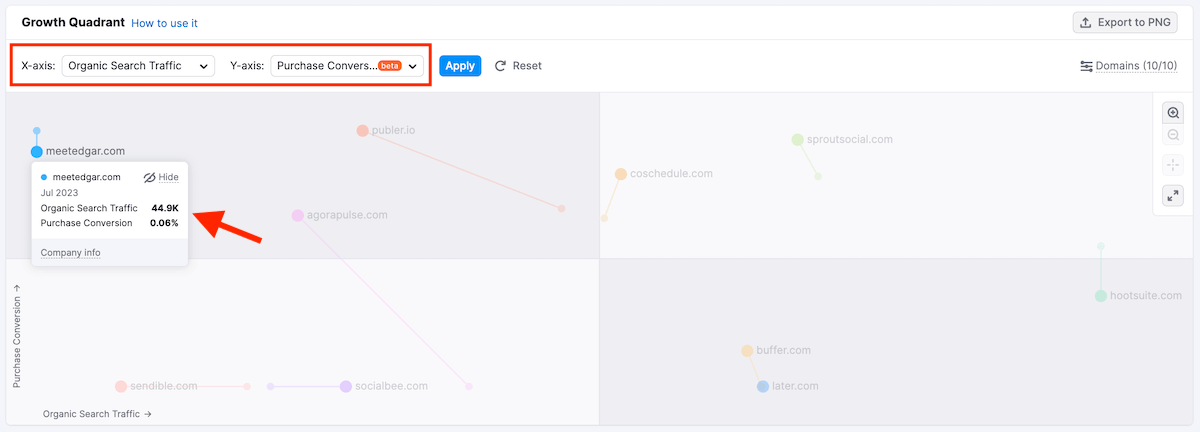
You can customize the view by setting up axes to analyze competitors from different perspectives.
For instance, you can change the metric in X-axis to "Organic Search Traffic" and Y-axis to "Purchase Conversion" to reveal what percentage of organic visits to your competitor's domain ended with a conversion.
Moving on, you'll come across the "Top Market Keywords" widget, which showcases a list of top keywords arranged as a word cloud. Essentially, these are the keywords responsible for driving traffic to your competitors' websites. The size of each keyword in the word cloud indicates its level of traffic and search volume.
If you want to see detailed metrics for a particular keyword, hover your cursor over it, and a window with specific search volume and traffic data will pop up.
On the right side of the Top Market Keywords word cloud, you'll find the Keyword Traffic chart. This chart illustrates the portion of organic traffic that a chosen keyword contributes to domains within the analyzed market.
Simply click on any keyword from the Top Market Keywords cloud to select it and change the chart data.
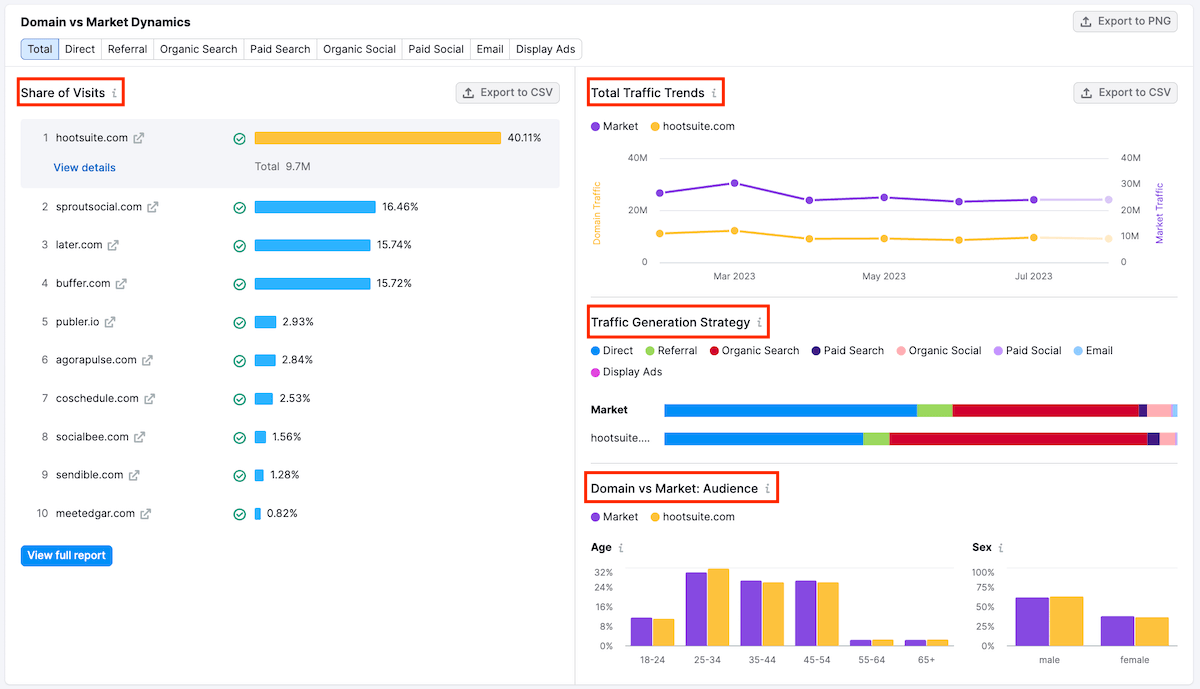
Next up is the "Domain vs Market Dynamics" widget that analyzes how well a single domain is doing in comparison to the overall market.
When you pick a domain from the "Share of Visits" widget located to the left of the chart, the chart will automatically display relevant data for that domain.
This chart serves a dual purpose: it helps you not only gauge your performance in relation to competitors but also in comparison to the broader market trends.
Next, you'll see the Market Geo Distribution section, which provides insights into the top five countries where your competitors receive the most significant traffic volume.
Finally, there's the Market Traffic chart, depicting the overall traffic trends over a specific period for all the analyzed websites within your selected market. This chart breaks down the traffic by its source channels.
By illustrating traffic trends over time, this chart lets you identify patterns, seasonality, and fluctuations in the market.
2. Gather Detailed Traffic Insights for Competing Websites (with Traffic Analytics)
The Traffic Analytics Overview report in Semrush's Traffic Analytics tool lets you sneak a peek at the kind of traffic your rivals' websites are getting.
This report allows you to thoroughly examine the tactics of your rivals, analyze user behavior, and uncover trends within your desired market.
To access this report, navigate to:
.Trends > Traffic Analytics
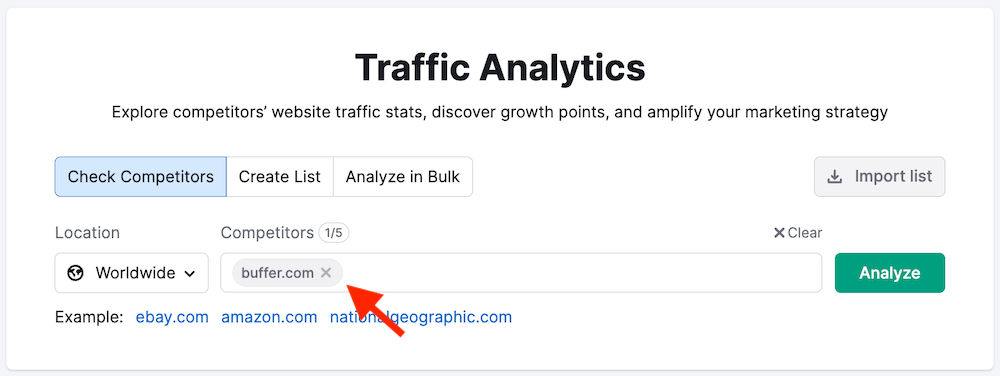
You can enter up to 5 competitors in the search box, but for this example, let's limit it to just one competitor.
Enter your competitor's domain in the search box and hit the "Analyze" button.
The resulting overview report will provide insights on important traffic performance metrics such as total monthly visits, unique visitors, pages/visit, avg. visit duration, and bounce rate.
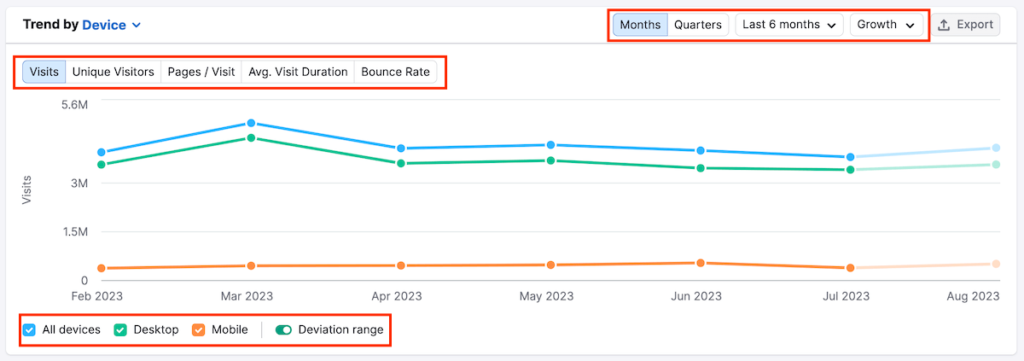
Below the metrics, you'll see a line graph which shows the traffic trends for the website. By default, the view is set to the last 6 months, but you can change it to 12 months, All time, or just the current year.
The trend graph also allows you to switch between a website's trend of total visits, unique visitors, pages/visit, average visit duration, or bounce rate.
The overall data presented here is really helpful in understanding the seasonal trends associated with the website you're analyzing in Traffic Analytics.
Below the line graph, you'll find a widget that shows you the website's top pages, top subfolders, and top subdomains. You can toggle between each of these options by clicking on the one you want to examine.
Next to this widget is the Traffic Share graph, which offers a breakdown of percentage of traffic via desktop vs mobile devices.
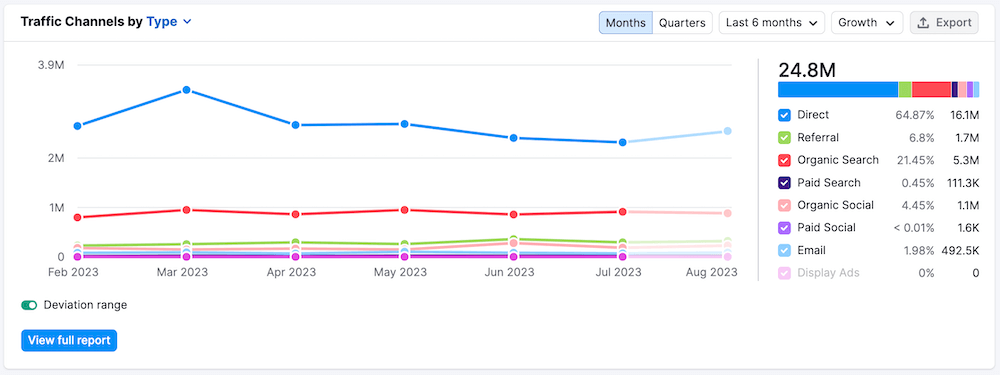
Moving on, you'll find the Traffic Channels chart, which provides a breakdown of the distribution of traffic among different source categories: direct, referral, organic social media, paid social media, organic search, paid search, email, and display ads.
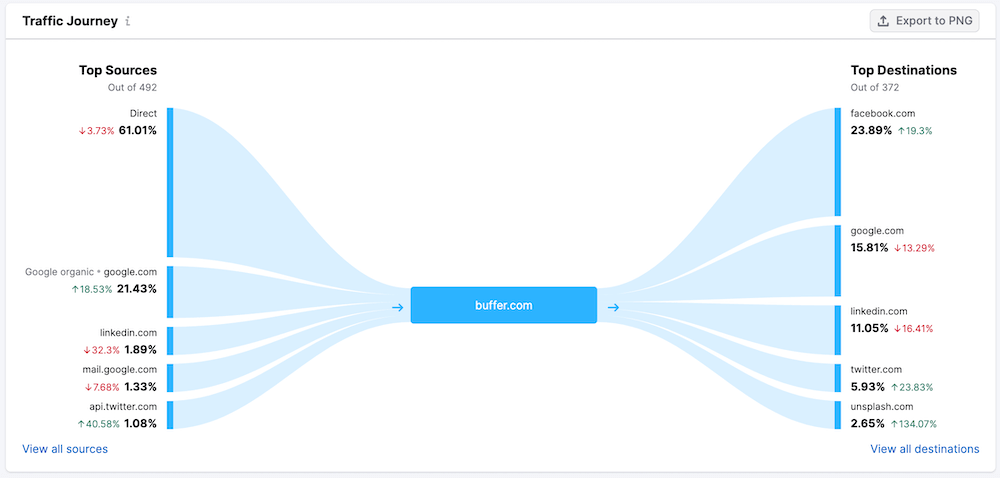
Next in line, you'll come across the Traffic Journey chart. This chart allows you to identify the sources generating the most traffic to your competitor's website, alongside top 5 external domains that users most frequently go to after visiting the analyzed domain.
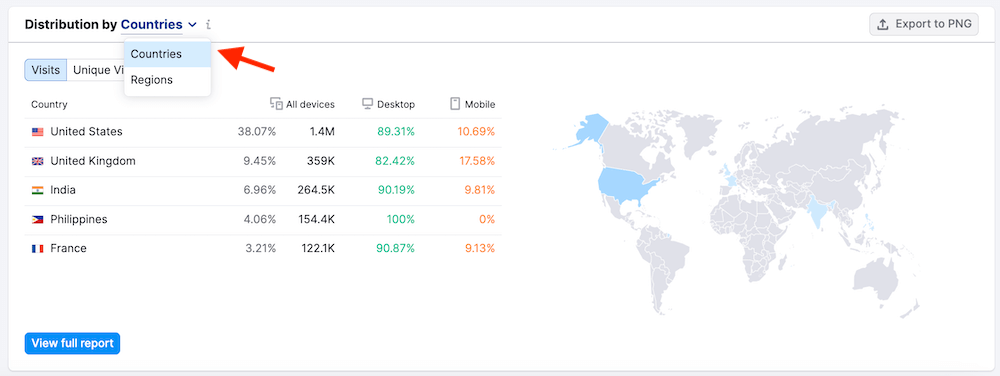
The final section of the Traffic Analytics Overview report is the Traffic Distribution widget. This shows you the countries and regions (business or geographical) that have the most users visiting your competitor's website.
You can dive deeper into each of these widgets to get the nitty-gritty on what your competitors are doing. We'll walk you through some of the key ones in this article, so keep reading to learn more.
Get a 2-week free trial to Semrush .Trends + Semrush Pro, gaining access to all .Trends tools and 45+ Semrush features.
3. Benchmark Your Website Against Competitors (with Traffic Analytics)
The Traffic Analytics tool allows you to benchmark the traffic stats of multiple websites side by side. By comparing the traffic metrics of your website with those of your competitors, you can gain a clear understanding of where you stand in the market.
To compare multiple websites, simply enter the domain names into the search boxes at the top of the Overview report in Traffic Analytics and hit the "Compare" button.
The Overview report will then show you the traffic metrics of all 5 websites you're analyzing. Below the metrics, you'll find a line chart for the websites, showing the historical trends and forecasts for the current month.
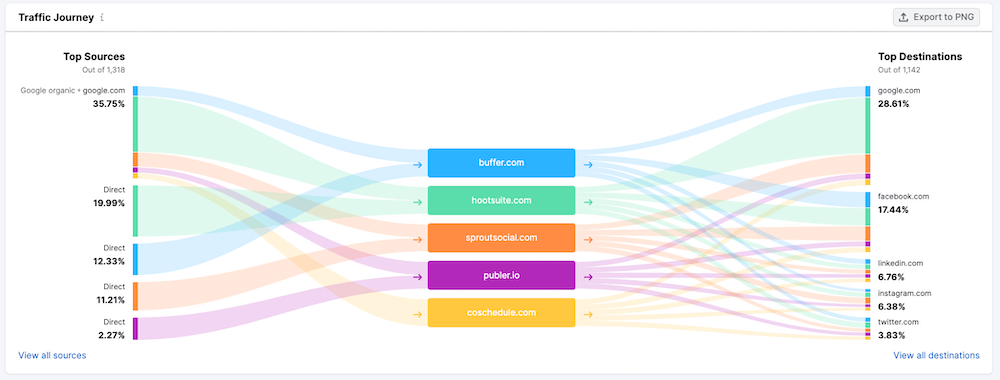
Below the line graph, you'll see the Traffic Sources, Traffic Journey, and Geographic Distribution widgets estimating each website's monthly traffic from each source.
These reports mirror the ones mentioned earlier, but now the charts present data for several domains that you are examining simultaneously.
This data will allow you to identify broader industry trends and patterns. You can also identify which competitors are outperforming others and understand the factors contributing to their success.
Related: 6 Powerful Ways You Can Use Semrush to Crush Your Competition
4. Analyze Your Competitors' Top Pages (with Traffic Analytics)
The Top Pages report in Traffic Analytics provides valuable insights into your competitors' website performance and content strategy. You can then use these insights to inform your content strategy, keyword targeting, and overall digital marketing efforts.
The Traffic Analytics Top Pages report shows you metrics of up to top 1000 pages based on traffic. These are pages that generate the highest number of unique visitors to your competitors' websites.
To access this report, visit the "Top Pages" tab in your Traffic Analytics report.
First, you'll see the "Insights" widget, which displays pages from your competitor's website that have been recently identified, are experiencing a decrease in traffic, or are witnessing an increase in traffic.
Using the tabs, you can filter the cards by Growing, Declining, or Newly Detected.
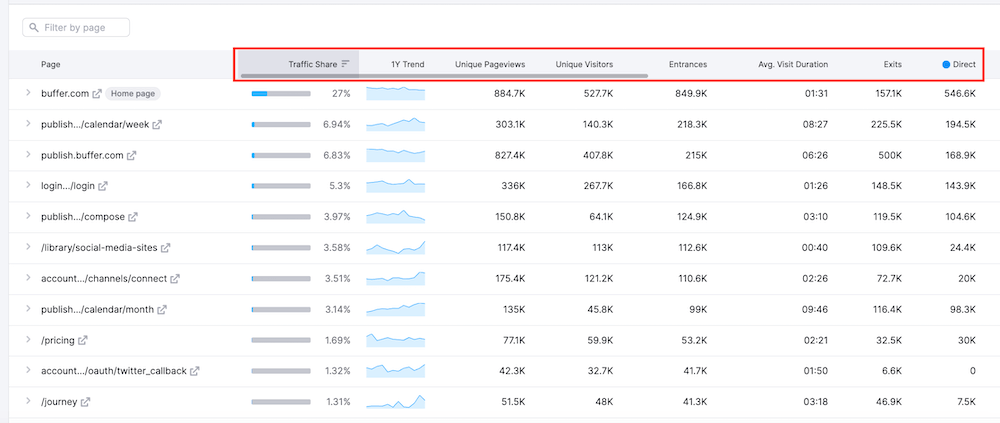
Below the Insights widget, you'll see a list of top pages from your competitor's site, alongside useful metrics such as traffic share, 1-year traffic trend, unique pageviews, unique visitors, entrances, and the different traffic sources.
In the above example, you can clearly see that Buffer's homepage draws the largest volume of total traffic (27%).
You can further analyze the top pages by expanding them.
Select any page to access a detailed analysis of the sources contributing to its traffic and historical data on unique pageviews, unique visitors, entrances, exits, and average visit duration.
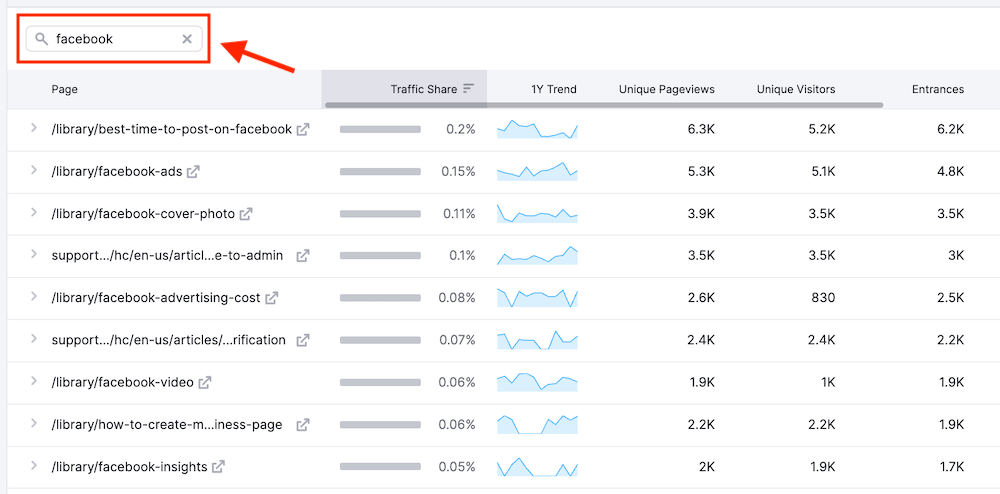
You can also use the search bar on top of the table to filter the list of top pages by a specific topic. For example, by searching for "facebook," you can find out if Buffer has any resources or blog posts related to Facebook on their blog.
5. Examine Your Competitors' Top Subdomains and Subfolders (with Traffic Analytics)
The Subdomains report in Traffic Analytics helps you analyze which subdomains of a competing website contribute the most to its overall traffic.
Similarly, the Subfolders report looks at which subfolders on a competitor's website are generating the most traffic.
To access the Subdomains report, visit the "Subdomains" tab from your Traffic Analytics report.
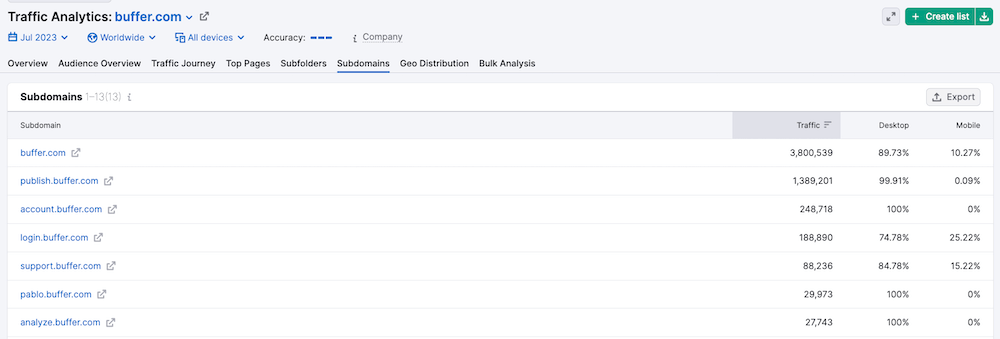
Here you'll find a list of subdomains from your competitor, alongside estimated monthly visits (both desktop and mobile) and traffic share.
The common subdomains you need to look out for fall in the following categories:
- Blog subdomains
- Support and knowledge base subdomains
- Store subdomains (for eCommerce stores)
- Course subdomains
- Podcast subdomains
- Product access subdomains (for SaaS companies)
- News subdomains
- Geographic subdomains
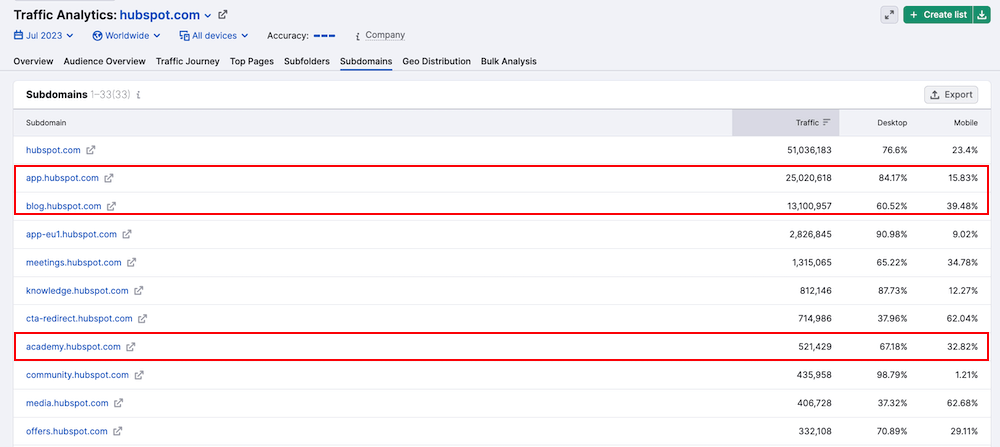
As an example, when I analyzed "HubSpot" with Traffic Analytics, I found the following subdomains contributing the most traffic.
As you can see, a large portion of their overall traffic goes to their product access subdomain, blog subdomain, and course subdomain.
On similar lines, to access the Subfolders report, visit the "Subfolders" tab from your Traffic Analytics report.
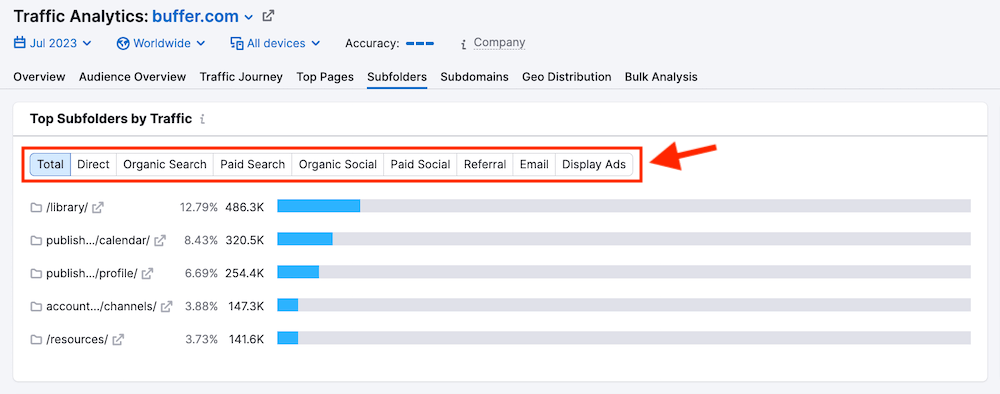
At the top of the Subfolders report, you'll find the "Top Subfolders by Traffic" widget which breaks down the top 5 subfolders in terms of previous month's traffic.
The default view relates to total traffic, but you can toggle between different sources (direct, referral, organic search, paid search, referral, etc.)
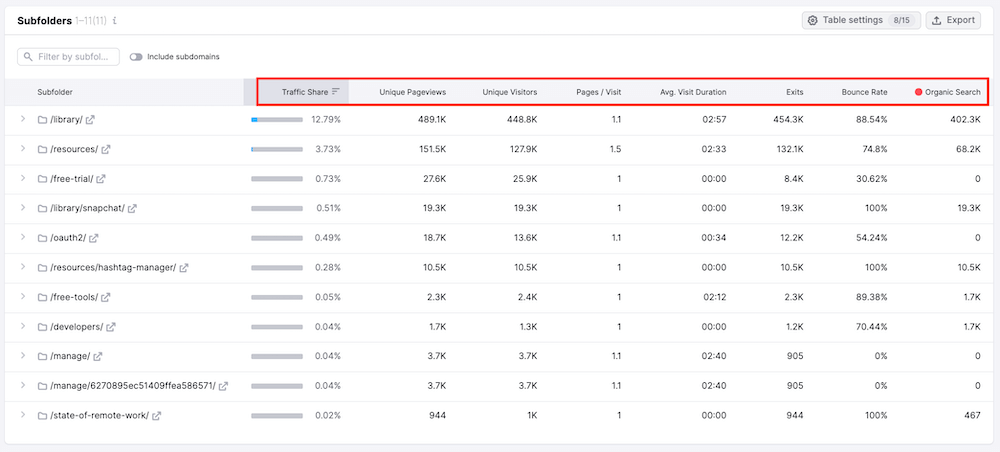
Below the widget, you'll find the Subfolders table which provides a breakdown of each subfolder's respective traffic into 8 major factors, including Traffic Share, Unique Pageviews, Unique Visitors, Pages/Visit, Exits, Average Visit Duration, Bounce Rate, and External Source.
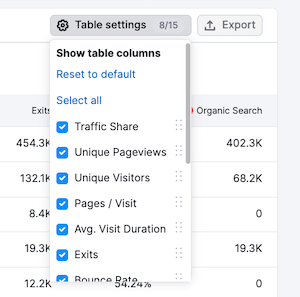
You can customize this table by clicking on "Table settings" and deselecting the columns that are not important in your research.
You can then download this data as a CSV or Google Sheets file.
6. Automate Competitor Tracking (with EyeOn)
With Semrush's EyeOn tool, you can automate the task of tracking competitor activities across the web. Once you create competitor lists via EyeOn, the tool monitors your competitor activities and sends you weekly updates on:
- Newly-published blog posts
- Recent advertising campaigns
- New pages on competitor websites
- New social media posts
To get started, select ".Trends" from the left navigation menu and click on "EyeOn."
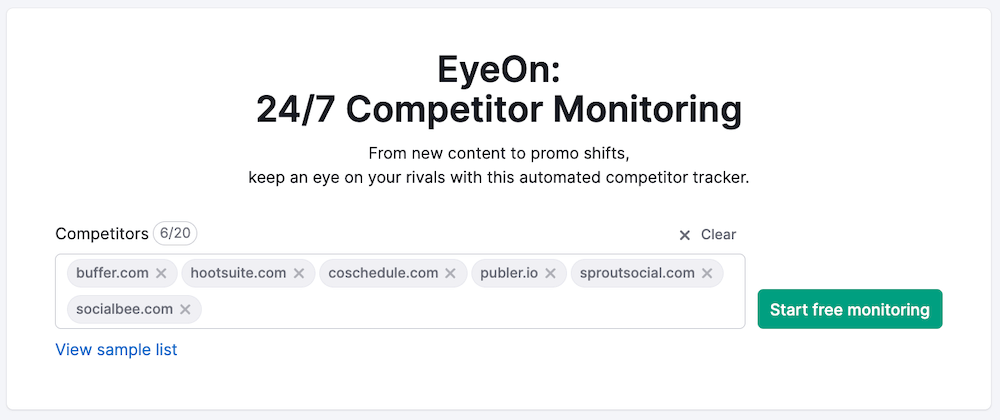
Enter up to 20 competitors into your list and hit the "Start monitoring" button.
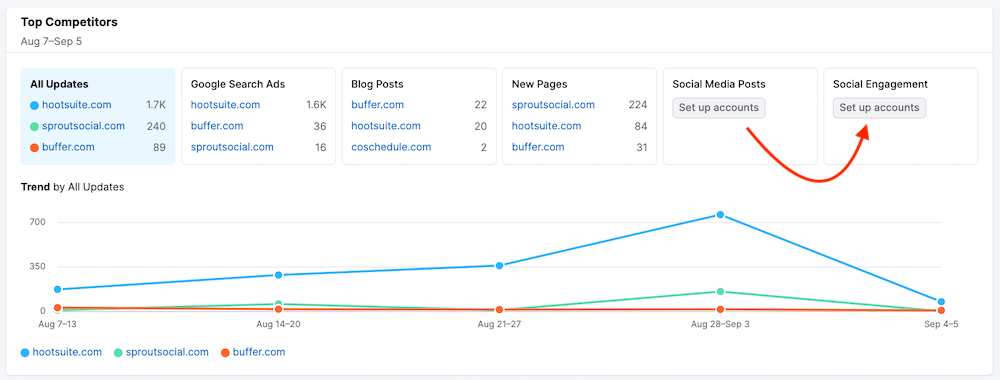
EyeOn will generate an Overview report where you'll see the number of updates for each competitor. You'll see a breakdown of their Google ads, blog posts, and new pages.
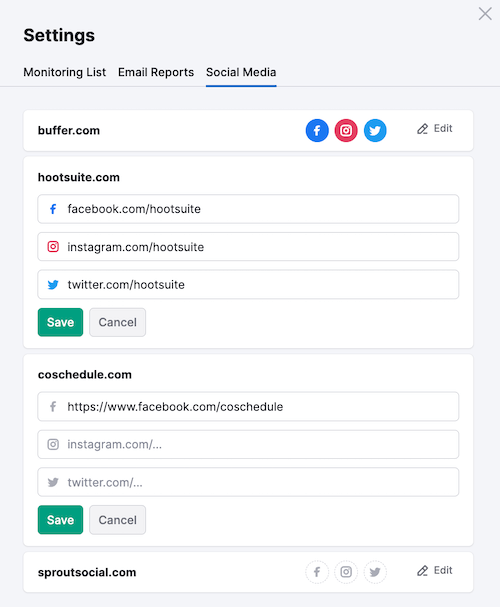
If you'd like to view data on your competitors' social media posts and engagement, you can do so by clicking on "Set up accounts" against the respective widgets and entering the URLs of your competitors' social pages as shown below:
The "Trend by All Updates" graph shows each competitor's number of updates over the selected timeframe.
The "Traffic Channels" widget leverages data from Traffic Analytics and allows you to compare your competitors' activity with the actual traffic they generate during a specific period.
You can zero in on individual competitors by selecting the competitor you'd like to examine from the Overview page.
You can adjust the trend graph by using the filters above to see data on All Updates, Google Search Ads, Blog Posts, New Pages, or Social Media.
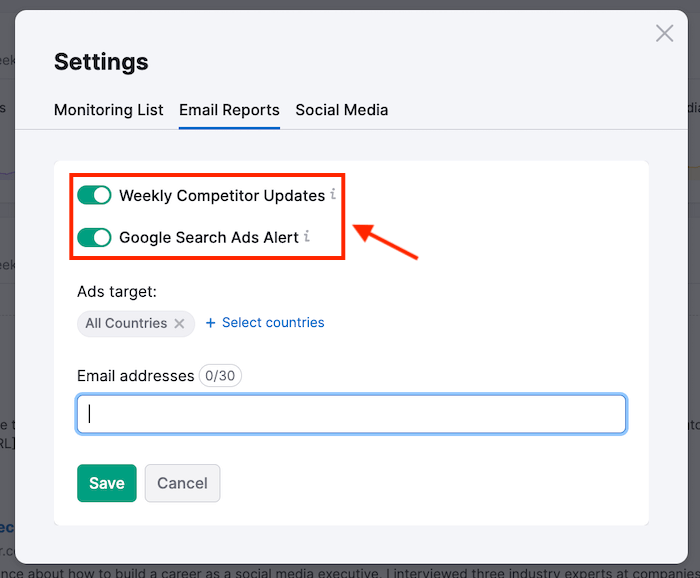
To receive weekly alerts on competitor updates, select the "Email report settings" option on top of the Overview report. You can opt to subscribe or unsubscribe from weekly email notifications and choose whether to receive weekly competitor updates and/or Google Ads alerts.
Related: How to Use Semrush to Maximize Your Content Marketing ROI
7. Research Your Audience (with One2Target)
One2Target is the audience research tool in
With One2Target, you can generate detailed reports on crucial audience characteristics such as demographics, socioeconomics, behavior, and audience overlap.
Each report offers a range of metrics with a breakdown of audience age, gender, location, device type, and social media preferences. Additionally, you can also find data on employment statuses, education levels, household sizes, income brackets, and more.
Armed with these valuable insights, you can figure out which audience segments could be the real game-changers for your business. You can then refine your marketing approach and successfully convert potential prospects into paying customers.
To get started with One2Target, navigate to:
.Trends > One2Target
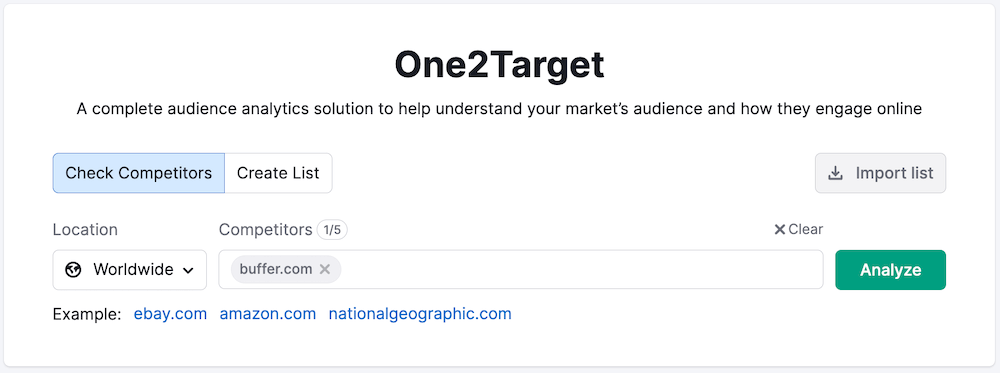
You can either import a list of domains from another .Trends tool or simply enter your competitor's domain in the search box and hit the "Analyze" button.
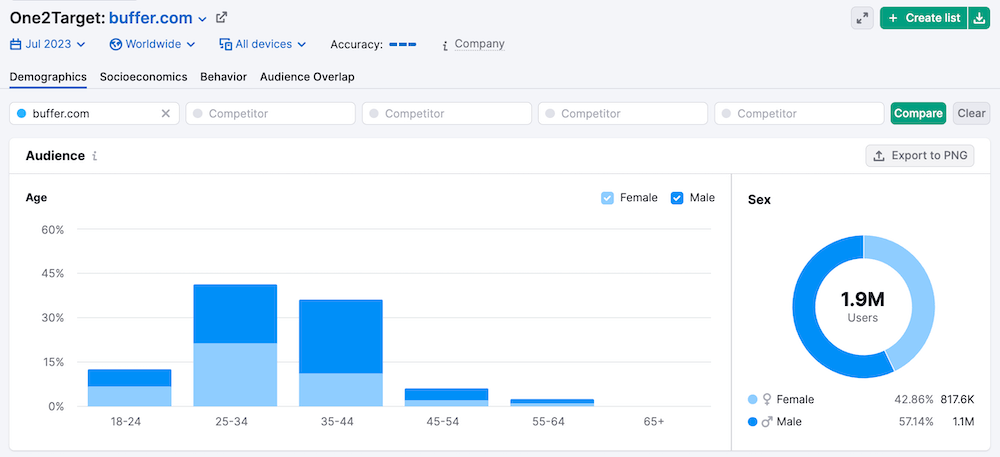
The first report you'll find is the Demographics report. This report provides broad demographic data points about your competitor's audience. It includes information about age, sex, unique visitors, and geographical location.
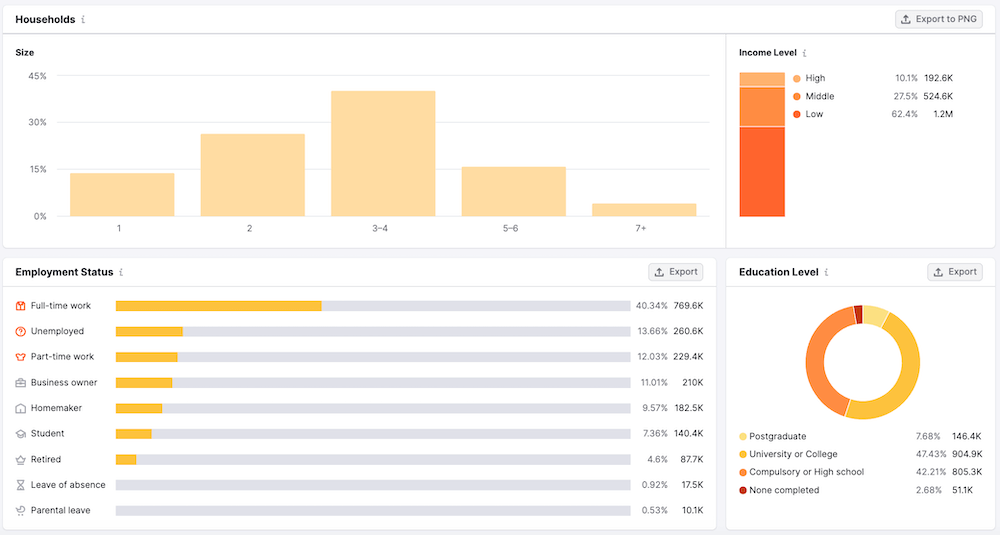
The Socioeconomics report provides insights into audience household sizes, income brackets, employment status, and education levels.
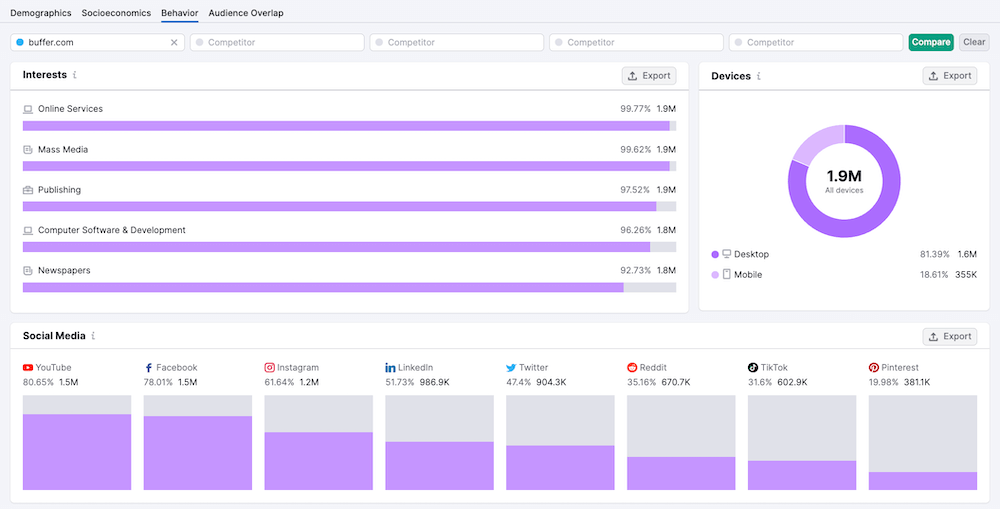
Moving on, the Behavior Report in One2Target offers insights into audience interests, device preferences, and social media usage.
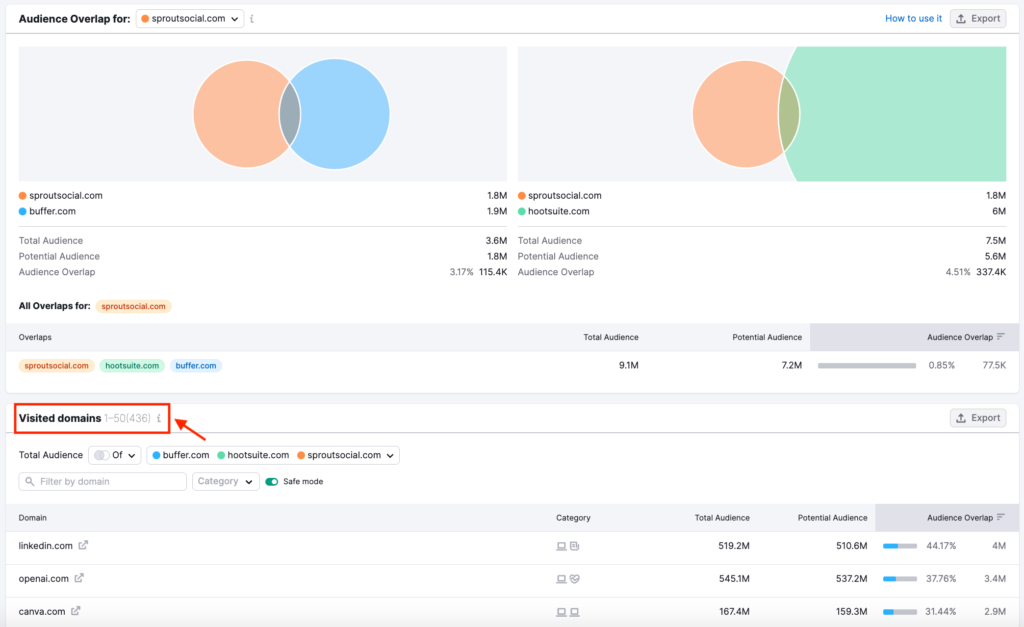
The final report in One2Target is the Audience Overlap report. This report works when you're analyzing multiple domains in the same market. It shows the percentage of the total audience that visits a particular website and how much of that audience is shared among websites in the same market.
Using the filters above the Visited domains table, you can compare the competitor domains and see their total shared audience. You can also identify areas where a domain might be failing to reach its potential audience.
Final Thoughts
Semrush .Trends offers a comprehensive suite of tools to deconstruct competitor strategies and enhance competitive intelligence.
With tools like Traffic Analytics, Market Explorer, EyeOn, and One2Target, you can gain valuable insights into your market, competitor performance, and audience characteristics.
The 7 actionable tips presented here will empower you to make data-driven decisions, identify growth opportunities, and stay ahead in the competitive landscape.
Sign up for a free trial of
Get a 2-week free trial to Semrush .Trends + Semrush Pro, gaining access to all .Trends tools and 45+ Semrush features.
Editor's Note: This article was originally published on September 11, 2023 and has been updated frequently since then for freshness, accuracy, and comprehensiveness.
Related Articles


